top of page

WHAT DO WE KNOW ABOUT METRO VANCOUVER
we are Growing. Quickly.
2.5 million
living here in 2016*
3.4 million
595,000
living here by 2041
more jobs in 2041**
*Data from 2016 Census
**Compared to 2006 figures

GROWTH REQUIRES INFRASTRUCTURE TO SUPPORT...
THE ECONOMY
$119 billion
region GDP*
3.9%
GDP growth 2013-17**
$6.5 billion
GDP contribution by Pacific Gateway Transportation⁺
70%
of total growth expected to be in an urban centre or along the frequent transit network⁺
$500mn - 1 bn
estimated cost of congestion in Metro Vancouver⁺⁺
*GVBOT Economic Scorecard 2016
**GVBOT Economic Scorecard 2018
⁺TransLink RTS Backgrounder #4
⁺⁺CD Howe Institute 2015 figures

BUT, MORE
IMPORTANTLY
It improves our
Quality of Life
public transit
walking
cycling
LOWER BODY MASS INDEX
MORE PHYSICAL ACTIVITY
ACTIVE TRANSPORTATION
BETTER REPORTED HEALTH*
STRONGER REPORTED SENSE OF COMMUNITY*
*Among cyclists and walkers
All data from Vancouver Coastal Health

BETTER PLANNING HELPS US TAKE CARE OF WHERE WE LIVE
37%
of regional emissions come from on-road transportation
25%
of regional emissions come from buildings
improving how we move and design our region can reduce this
INFRASTRUCTURE MUST ALSO WITHSTAND CLIMATE CHANGE & NATURAL DISASTERS
sea level rise
wildfires
seismic activity
disease outbreak
All data from Metro Vancouver.

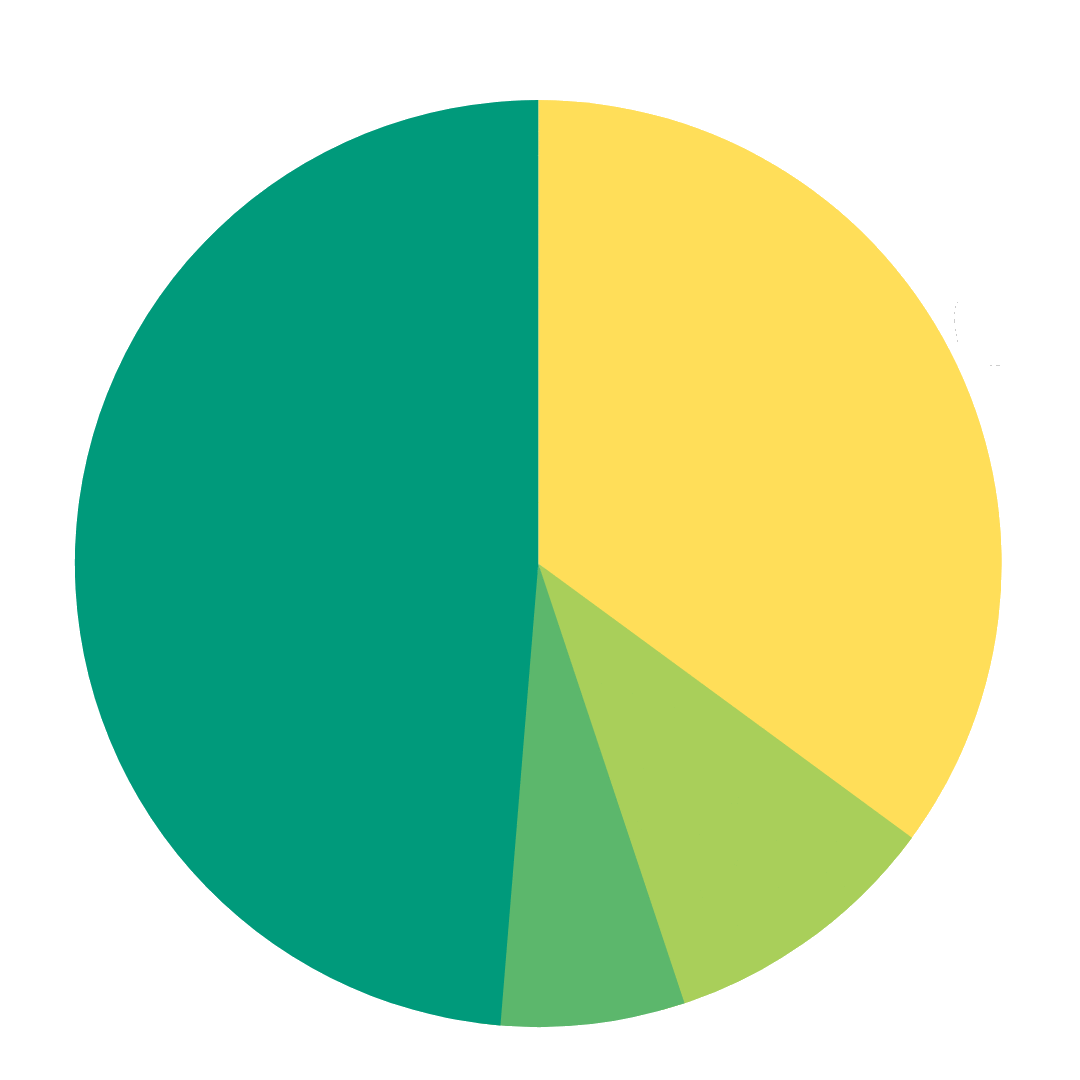
HOW DO WE PAY FOR TRANSIT ACROSS THE REGION
9.8% GOVT TRANSFERS
OTHER 1.7%
35% FARES

TAXES 48.6%
TransLink's 2017
Year-End Financial Report - Revenues
$2 billion
from the Government of Canada towards Phase 2 projects
$2.5 billion
from the Government of BC towards
Phase 2 projects
FUNDING FOR THE 10-YEAR VISION
All data from TransLink.
bottom of page
.png)